


by Peter J. Connors, CFA, on April 01, 2021
A year ago it would have been hard to imagine that within 12 months we would be reaching market highs. A novel virus was taking brutal foothold, disrupting world economies and creating massive uncertainty. The markets reacted in equally dramatic form, with the S&P 500® Index tumbling 34% over 22 days beginning in mid-February of 2020. Many pundits’ declaration of the “end of the longest bull run of the century” was short-lived, as we reached new highs within the year.
So what does that mean for the market in Year Two?
Since World War II, there have been six bear-market declines in excess of 30% magnitude. As shown below, in all years the S&P 500® was up firmly the first year post-correction – with an average return of more than 40%. These gains continued in Year Two, up a solid 16.9% on average. As most investors have learned, markets experience pullbacks on their climb higher, as reflected in the numbers shown.
NEW BULL MARKETS HISTORICALLY BUILD ON YEAR ONE GAINS IN YEAR TWO
S&P 500® Index Performance follow > 30% Bear Market Bottoms
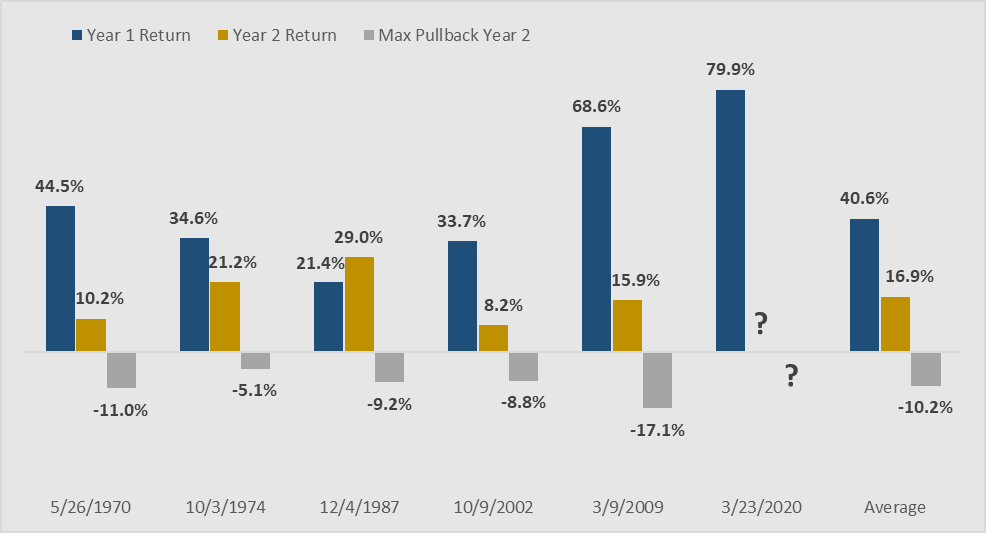 Source: LPL Research, FactSet 03/31/2021
The double-barreled fiscal and monetary policy that has been deployed over the past year has helped to push the U.S. economy forward and equity markets higher. Thus far, fiscal support includes successive waves of stimulus with a $1.9 trillion package passed in March on the heels of the $900 billion package last December. On the horizon is the possibility of another $2 trillion with President Biden’s proposed package to overhaul and upgrade the nation’s infrastructure. In addition, the Fed is resolute to keep monetary policy accommodative and not risk short-circuiting the recovery, even if inflation rises. The cost burden of these programs remains a longer-term concern especially if federal borrowing continues to outstrip GDP growth.
At the end of last year, there had been a broadening recovery in stocks and a rotation to more cyclical sectors that are sensitive to economic momentum. The first quarter of 2021 saw a continuation of that rotation. Basic Materials, Financial Services and Energy continue to lead, building on outperformance that began with the positive vaccine news last November.
As we enter the second quarter, economic reemergence data suggest a favorable outlook for U.S. stocks. U.S. economic leading indicators are pointing toward rapidly strengthening economic growth. The Institute for Supply Management (ISM) Services and Manufacturing Purchasing Managers indices recently posted historically high levels. While the Services index posted its highest level since its inception in 1997, Manufacturing notched to 64.7 in March, its highest level in 38 years. The last two U.S. jobs reports have shown considerable growth, especially in the remaining COVID-19-impacted parts of the economy. Of the nearly 1.4 million private sector jobs added in the last two months, the leisure and hospitality segment leads the way with 664,000 additions as the economy continues reopening.
Markets are reflecting this encouraging economic news. But, as always, investors should be prepared for unforeseen events, disruptions, or even economic overheating which could lead to higher volatility. The benign inflation environment which we have enjoyed for many years could be vulnerable to change given the massive stimulus to date. And with the pandemic, disappointments in vaccine supply, distribution or adoption — or increased risk from virus variants — are all hazards on the road to economic recovery.
With vaccination rates rising and economic growth firming, equity markets look favorable within the economic cycle, albeit at a moderating pace and with potential heightened volatility.
As always, and with cautious optimism, we continue to carefully monitor market conditions as we manage your portfolio to meet your objectives.
Sincerely,

Peter J. Connors, CFA
President
Important Disclosure
This material is being provided for informational purposes only. Any information should not be deemed a recommendation to buy, hold or sell any security. Certain information has been obtained from third-party sources we consider reliable, but we do not guarantee that such information is accurate or complete. This report is not a complete description of the securities, markets, or developments referred to in this material and does not include all available data necessary for making an investment decision. Prior to making an investment decision, please consult with your financial advisor about your individual situation. Investing involves risk and you may incur a profit or loss regardless of strategy selected. There is no guarantee that the statements, opinions or forecasts provided herein will prove to be correct. Opinions are subject to change without notice.
Please remember that past performance may not be indicative of future results. Different types of investments involve varying degrees of risk, and there can be no assurance that the future performance of any specific investment, investment strategy, or product (including the investments and/or investment strategies recommended or undertaken by Connors Investor Services, Inc. [“Connors]), or any non-investment related content, made reference to directly or indirectly in this commentary will be profitable, equal any corresponding indicated historical performance level(s), be suitable for your portfolio or individual situation, or prove successful. Due to various factors, including changing market conditions and/or applicable laws, the content may no longer be reflective of current opinions or positions. Moreover, you should not assume that any discussion or information contained in this commentary serves as the receipt of, or as a substitute for, personalized investment advice from Connors. Historical performance results for investment indices, benchmarks, and/or categories have been provided for general informational/comparison purposes only, and generally do not reflect the deduction of transaction and/or custodial charges, the deduction of an investment management fee, nor the impact of taxes, the incurrence of which would have the effect of decreasing historical performance results. It should not be assumed that your Connors account holdings correspond directly to any comparative indices or categories. Please Also Note: (1) performance results do not reflect the impact of taxes; (2) comparative benchmarks/indices may be more or less volatile than your Connors accounts; and, (3) a description of each comparative benchmark/index is available upon request.